Empowering patients to recover safely from home — while reducing clinician strain and expanding hospital capacity.
Project overview
The Patient iPad App empowers patients to recover safely at home by tracking their biometric readings and sharing them in real time with their care teams. Designed for ease of use and accessibility, the app guides patients through their recovery while keeping nurses informed and connected. This solution helps hospitals free up beds, improves patient outcomes, and elevates the overall patient experience.
Increase Hospital Capacity
Reduce inpatient stays by 10% by enabling eligible patients to continue recovery at home, freeing up hospital beds for higher-acuity cases.
Improve Operational Efficiency
Streamline remote patient monitoring for nurses and care teams, reducing the time spent on administrative workload and manual check-ins by 30%.
Enhance Patient Outcomes and Satisfaction
Support faster recovery maintain patient satisfaction scores of 4 our of 5 or better through continuous biometric tracking and personalized care in the comfort of home.
Early Market Validation
Stakeholder interviews
User interviews
Competitor Analysis
01
Proof of Concept
Prototyping
Concept Testing
Usability Testing
02
Prototype & Develop
IA Mapping
Prototyping
Usability Testing
03
Minimum Viable Product
User Interviews
Surveys
In-app feedback
04
Qualitative User Research
I conducted six 1-hour semi-structured interviews with clinical staff to understand their workflows, challenges, and expectations for remote care. To capture the patient perspective, I held three unstructured interviews with former patients and five structured interviews with non-patients matching the target demographic. Together, these sessions helped me assess users’ technical comfort, mental models, and opportunities to create meaningful value through a more intuitive and supportive digital experience.
I’m not very tech-savvy, so at first I was nervous about using the iPad—but once I saw how easy it was to check my readings and send them to the nurse, it actually made me feel more in control of my recovery.
Key user insights
Patients need reassurance and simplicity
Patients want meaningful connection with their care team
Interface exploration

Navigation
I initially hypothesized that a bottom navigation was superior because it would allow for more space to display items on-screen, but in user testing, 3 of 4 users failed to identify navigation menu items when tasked with navigating to other pages in-app, which resulted in further concepts using a left navigation.

Care Episode Overview
One concept hypothesized that a wholistic, all-in-one view of items related to the patients care episode could eliminate the need to navigate away from the home page by displaying all relevant information. However, I ultimately learned that patients preferred simplicity and predictability above all else.

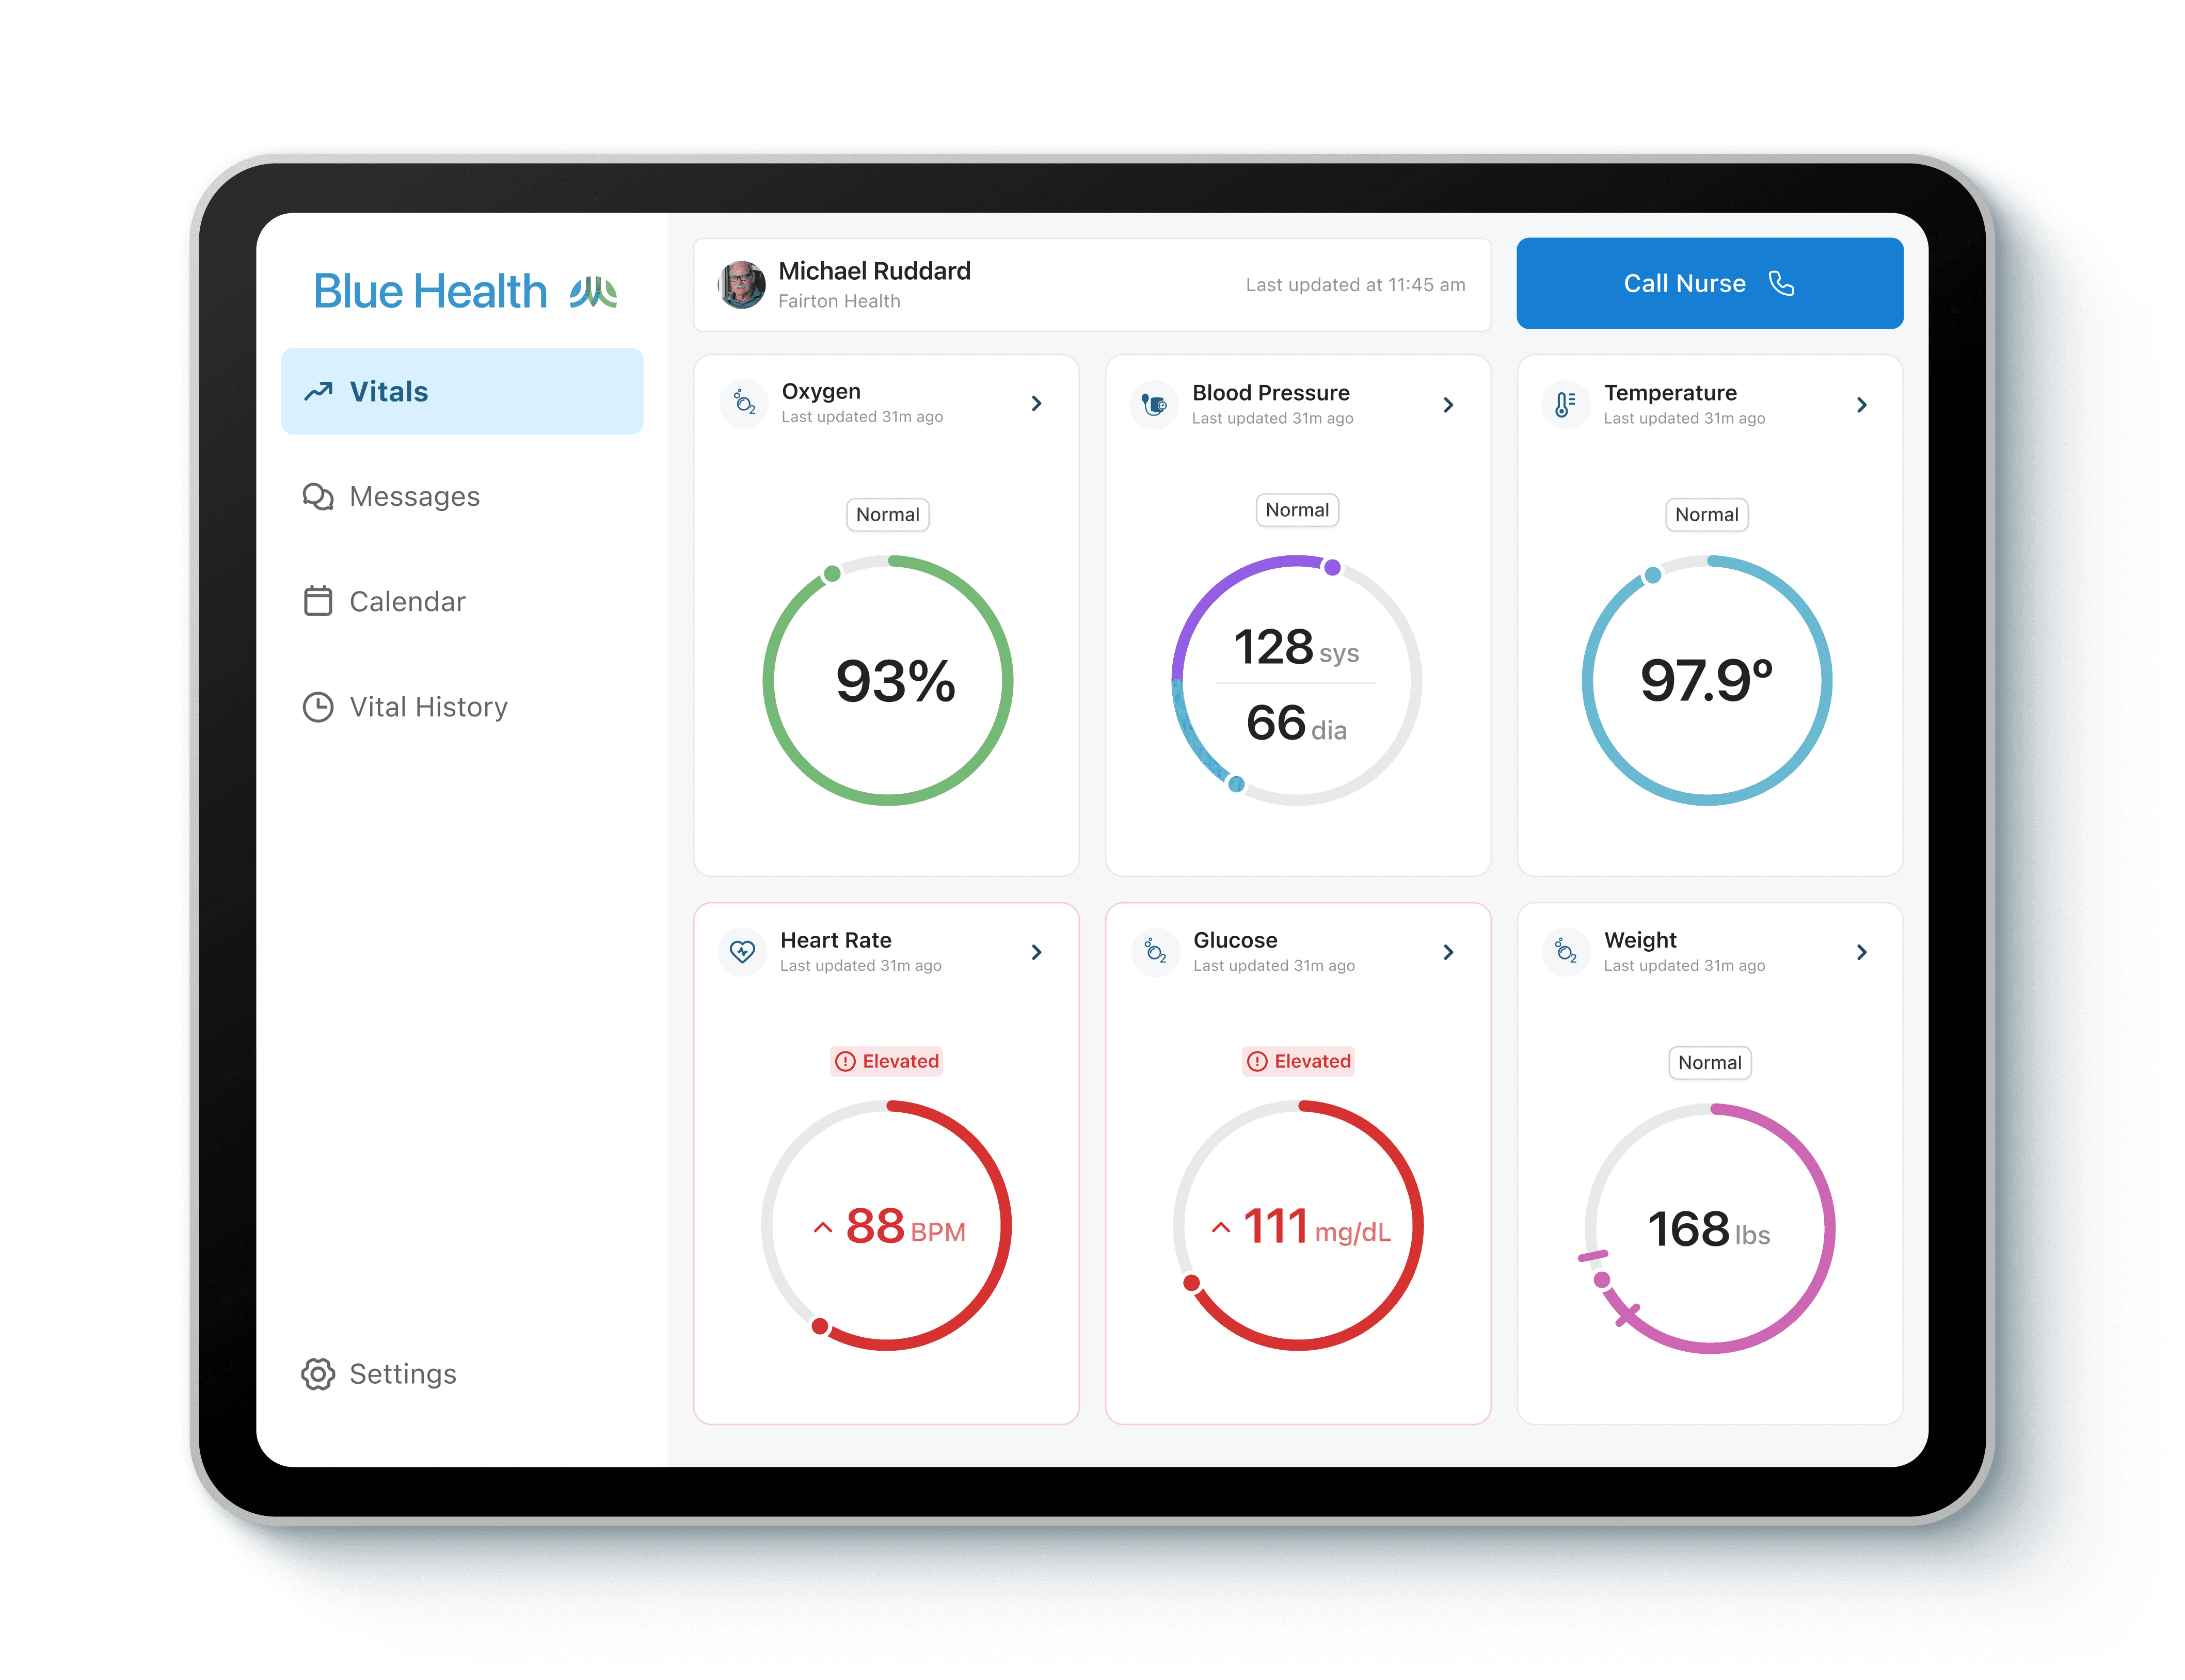
Solution
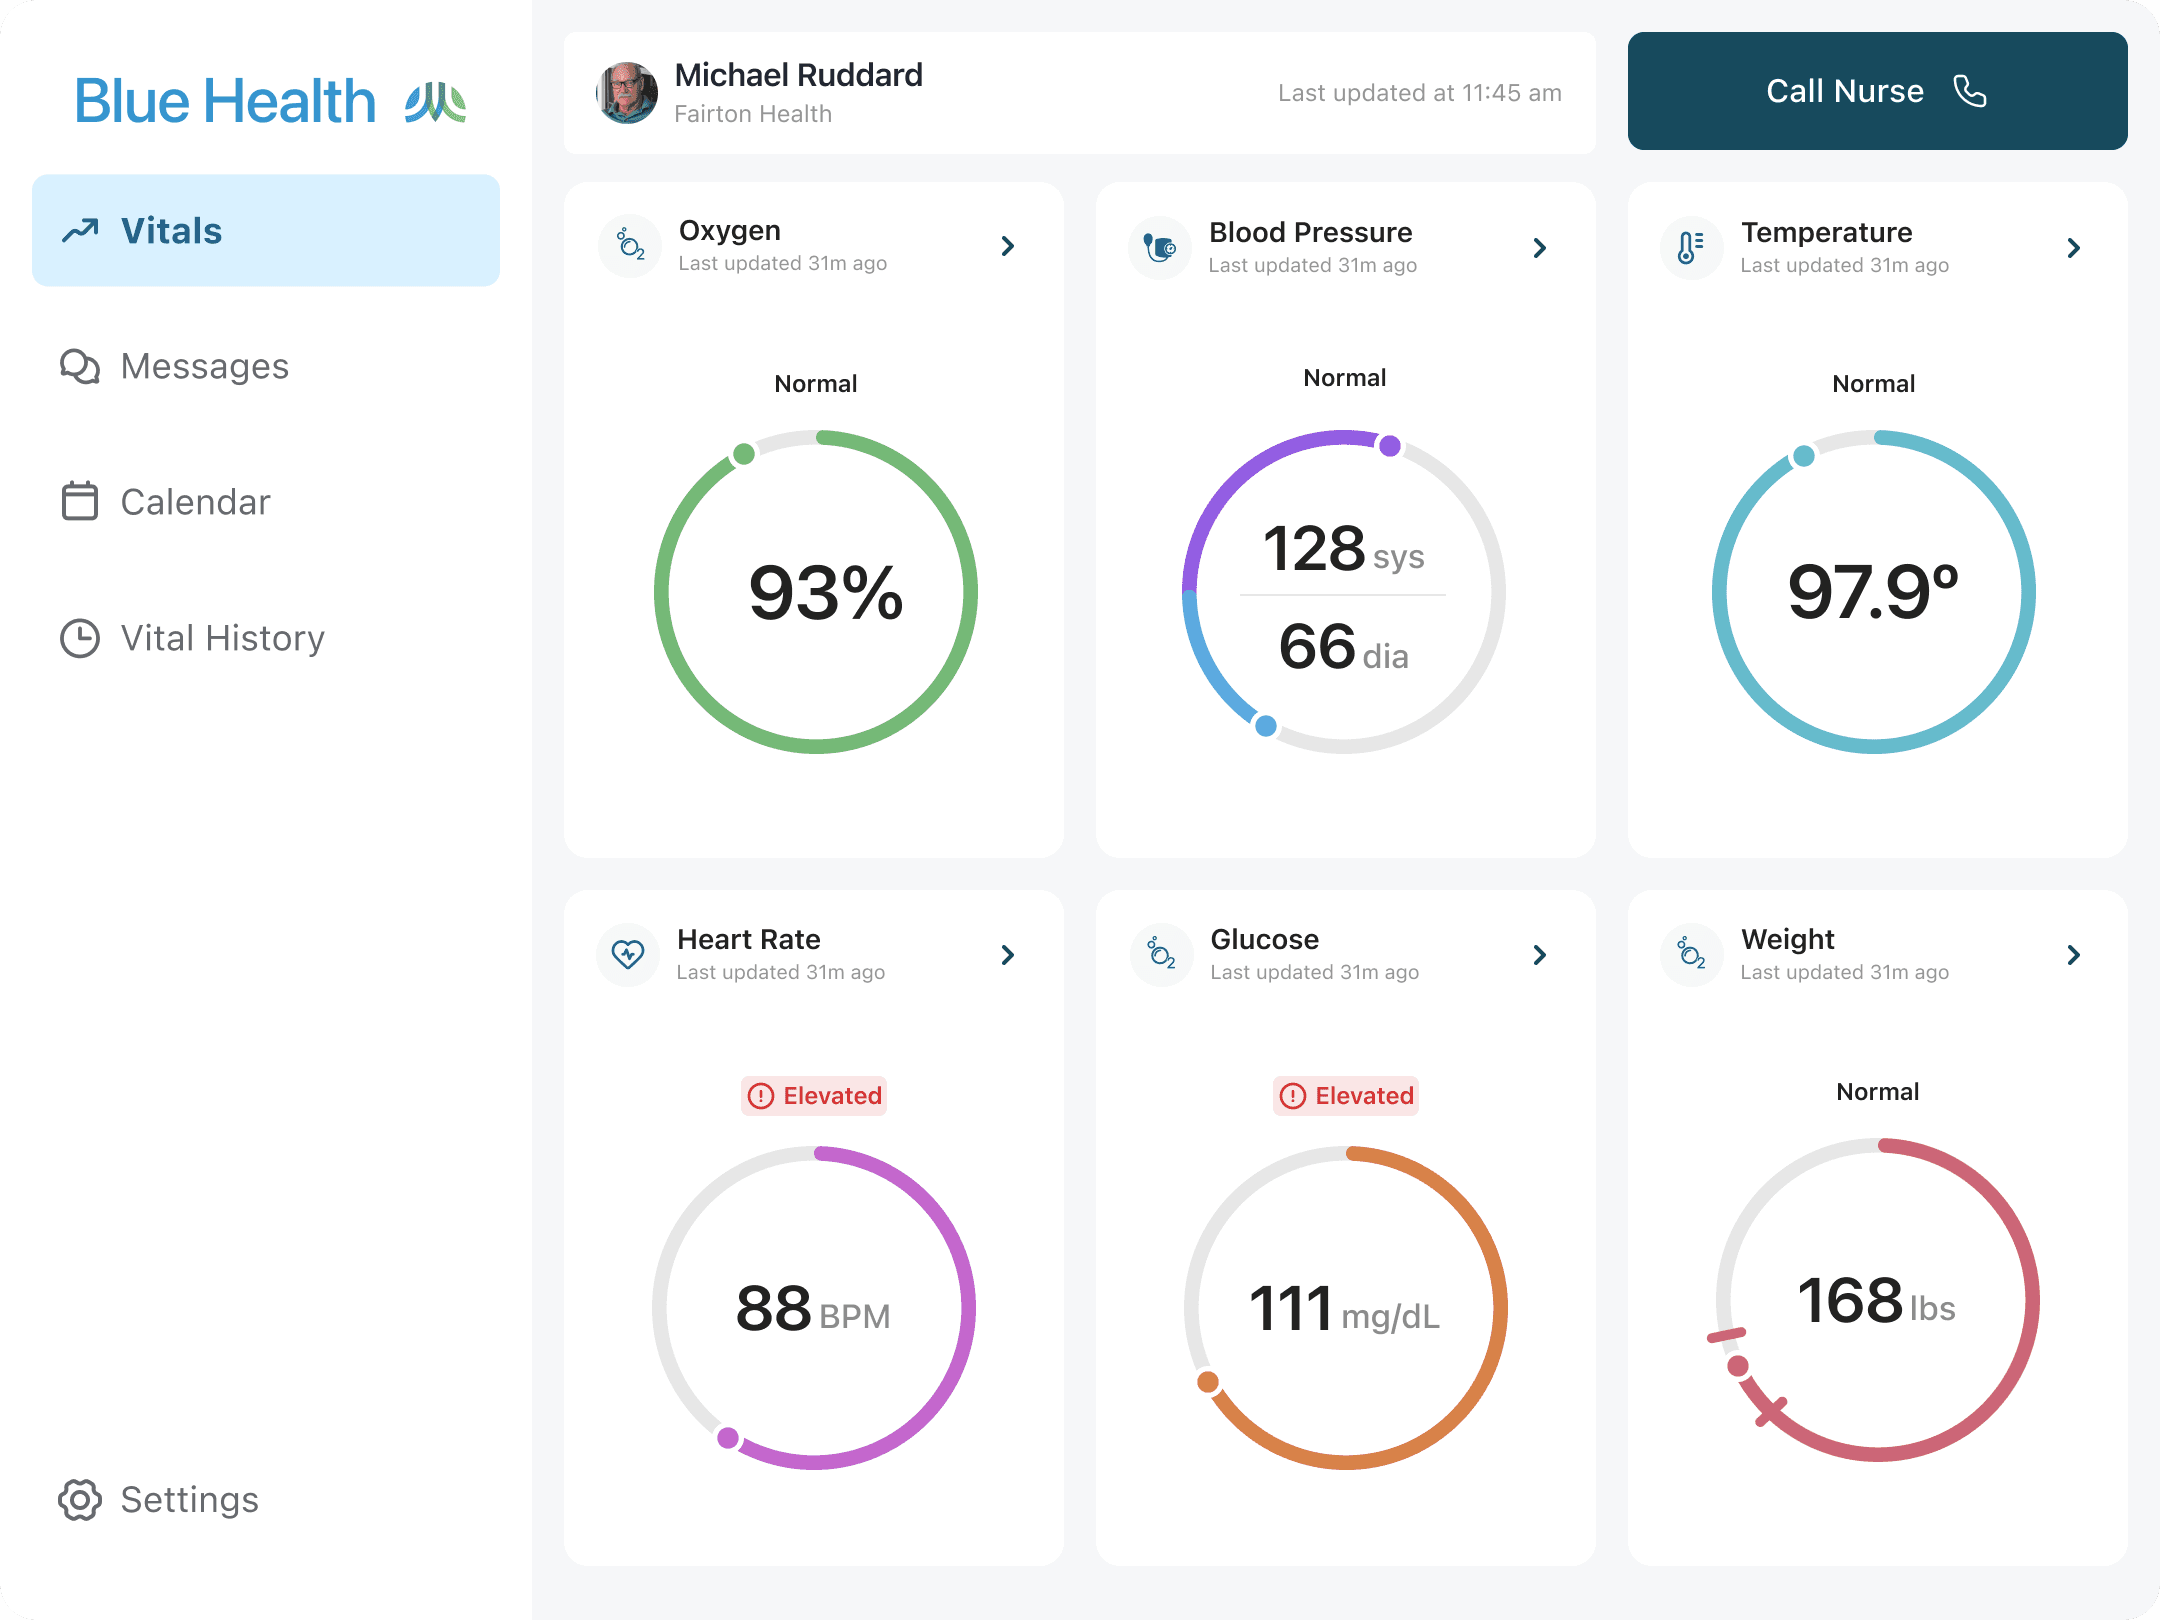
Center stage. Simple.
Patients want to easily be able to see their vital readings, so I chose to let this data take center stage with a minimal approach. Biometric data immediately appears in these components when taken with the provided biometric devices.
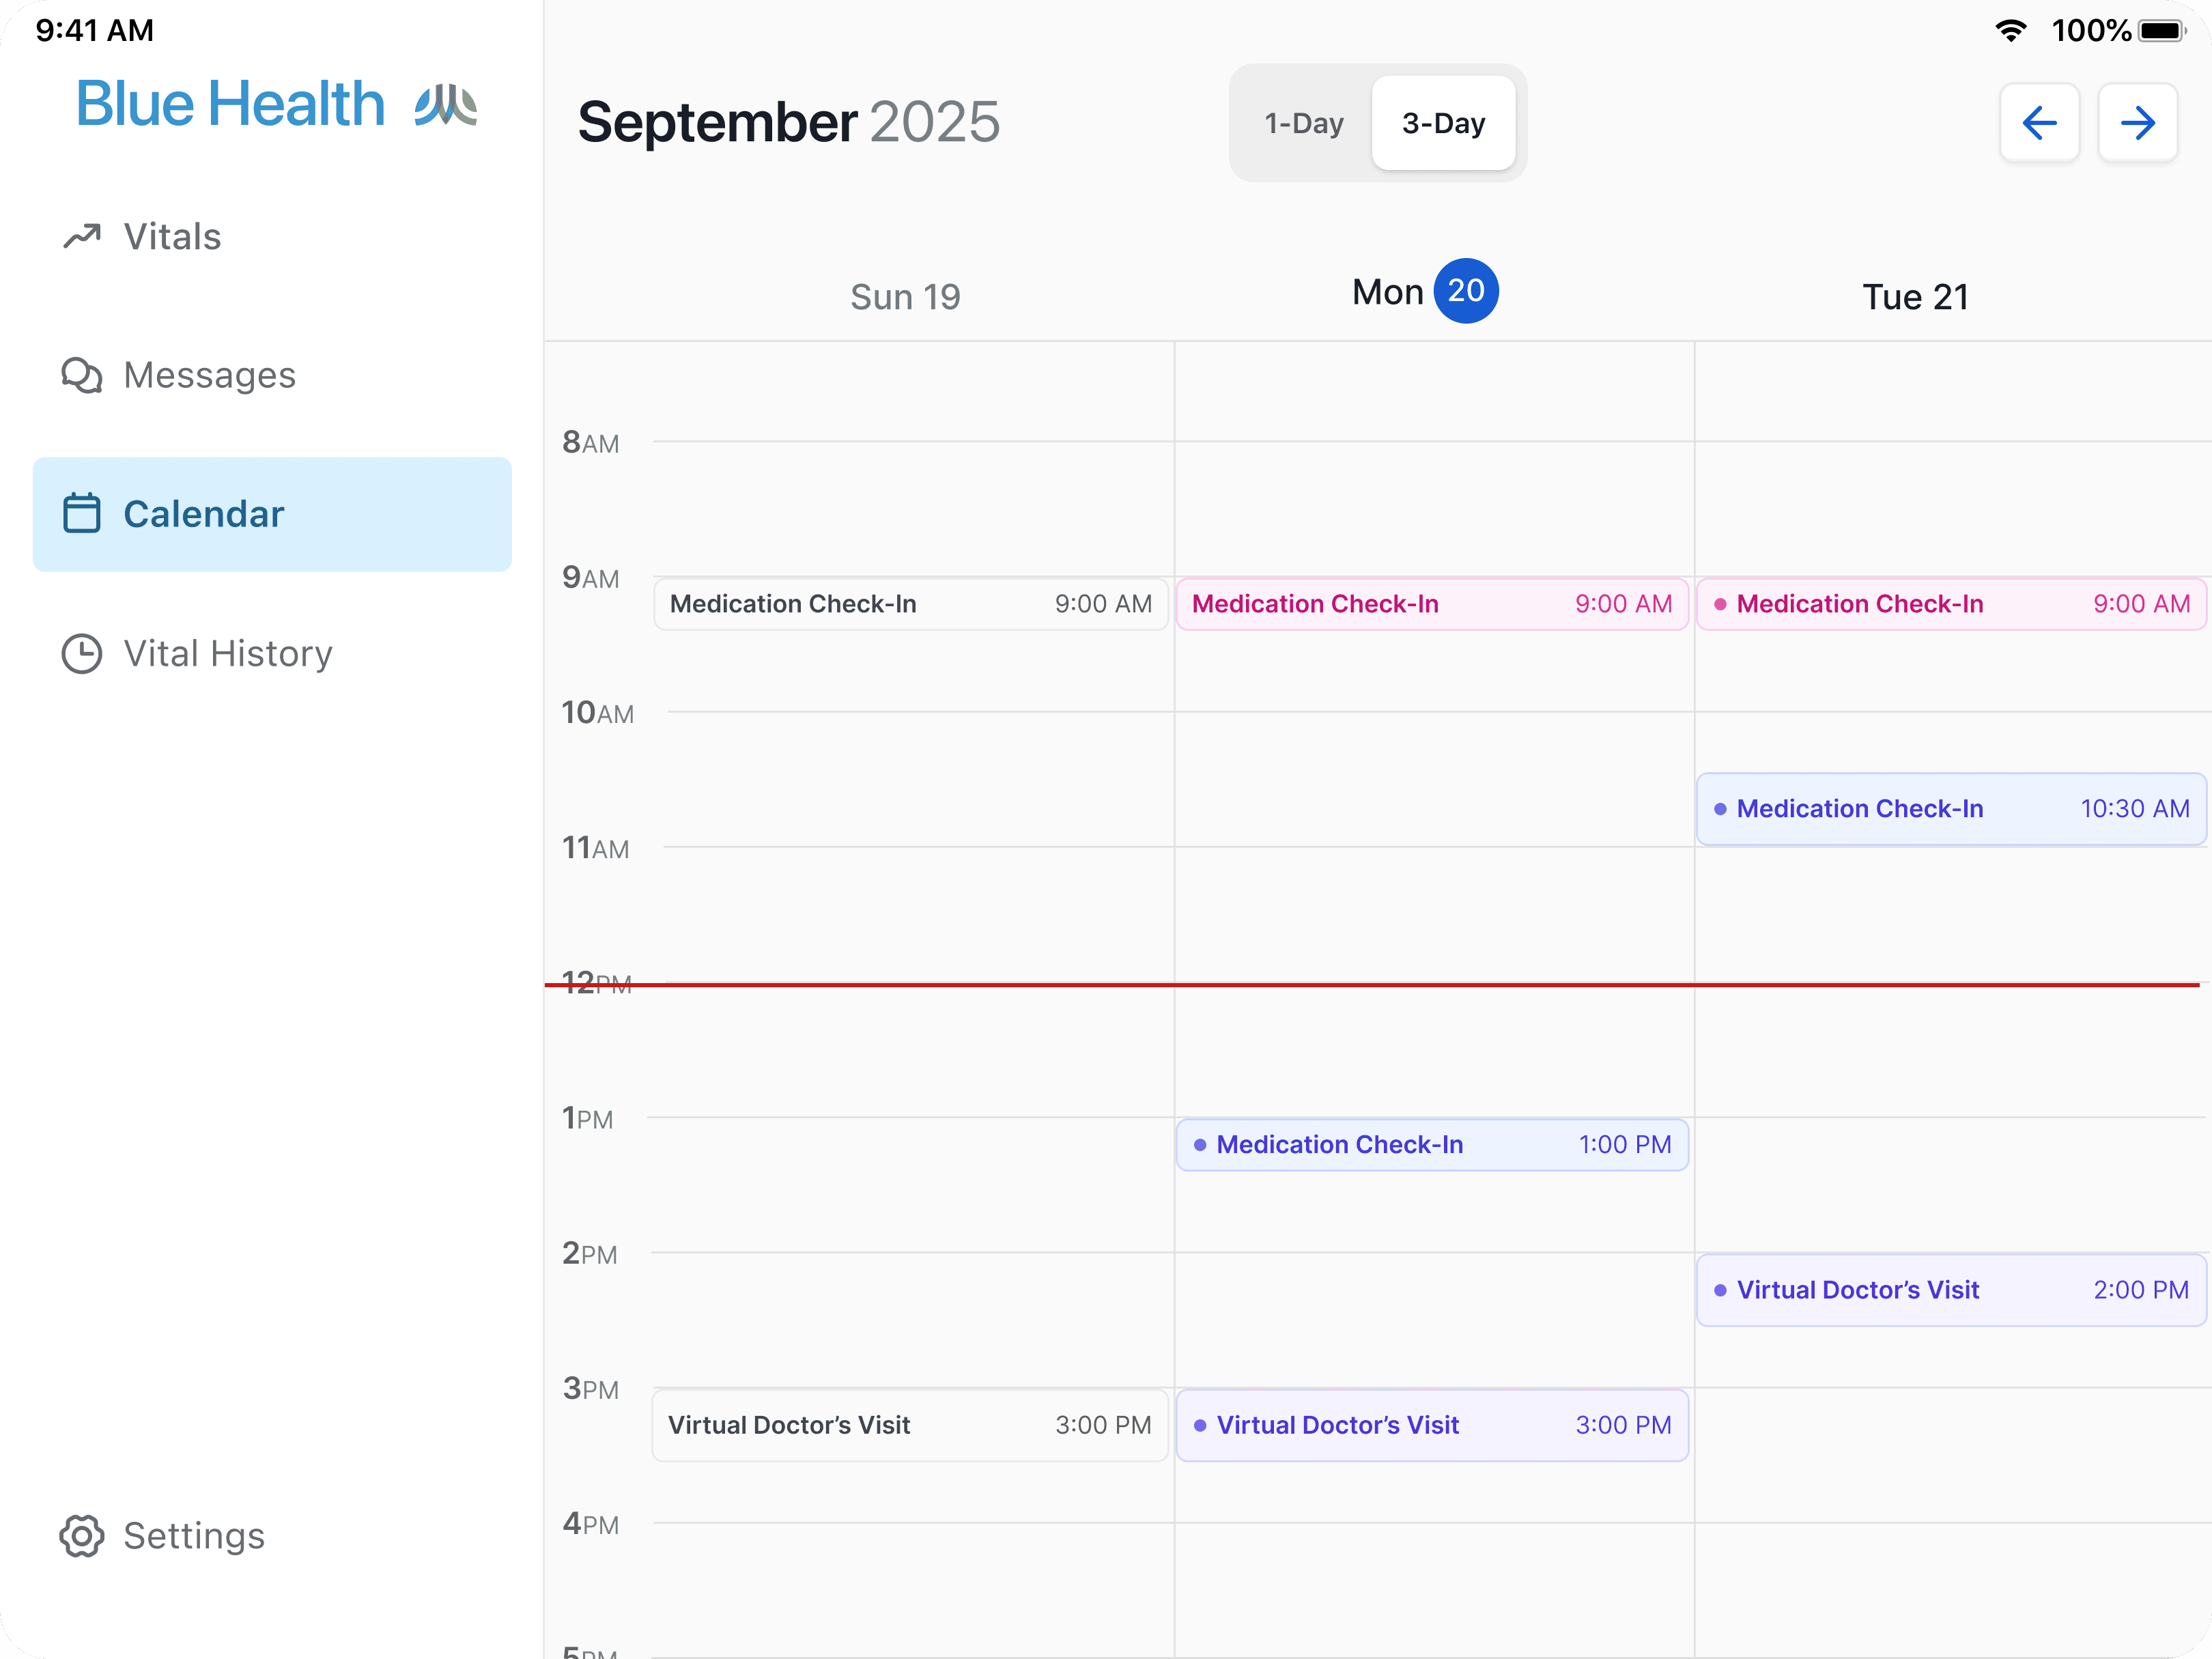
Familiar Calendar Format
75% of user testing participants reported using Google Calendar to manage events in their personal lives, and 90% of users reported using a hard copy calendar in addition to or in place of a digital calendar
The Clinical Assistant is the role responsible for scheduling patients’ daily visits with doctors and typically schedule virtual appointments for patients 3-7 days in advance.

Visualizing the data
2 out of 8 of our initial test participants reported using health tracking apps like Apple Health to track their steps, which made me curious to understand how they prefer to see data visualized.
While the bar graph in Apple Health was seen as useful to see their daily steps data, when presented with a side by side of a table and bar graph, all 8 participants preferred to see a table to view the historical biometric readings.


Group chat
The second most preferred way to communicate with the clinical team is via messaging. 90% of test participants reported using MyChart to communicate with other healthcare providers, and based on their experience with it, expected to be able to communicate with their care team by message and receive a response within ~48 hours.
Business Impact
Inbound Health is forecasted to reduce the amount of unnecessary inpatient stays by 50 patients per month on the conservative end, reducing the number of days patients spend in hospital beds unnecessarily, which alleviates the backlogs in emergency departments and allows health systems to provide care for the patients that need it most -- all while saving and earning more.
Savings per hospital per year
$900,000 - $1,800,0000
Questions about my work?